| Input | tbl | troff | tbleps |
|---|
.TS
center, box;
c s s s
c s s s
c |c |c |c
c |c |c |c
l |n |n |n.
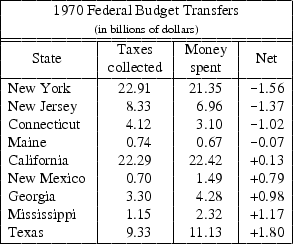
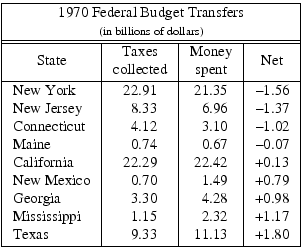
1970 Federal Budget Transfers
\s-2(in billions of dollars)\s0
=
State Taxes Money Net
\^ collected spent \^
_
New York 22.91 21.35 \-1.56
New Jersey 8.33 6.96 \-1.37
Connecticut 4.12 3.10 \-1.02
Maine 0.74 0.67 \-0.07
California 22.29 22.42 +0.13
New Mexico 0.70 1.49 +0.79
Georgia 3.30 4.28 +0.98
Mississippi 1.15 2.32 +1.17
Texas 9.33 11.13 +1.80
.TE
|  |  |
.TS
center;
l6 n.
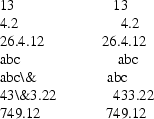
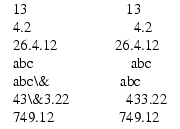
13 13
4.2 4\&.2
26.4.12 26.4\&.12
abc abc
abc\e& abc\&
43\e&3.22 43\&3.22
749.12 749\&.12
.TE
|  |  |
.TS
c s s
l n n.
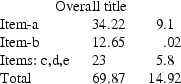
Overall title
Item-a 34.22 9.1
Item-b 12.65 .02
Items: c,d,e 23 5.8
Total 69.87 14.92
.TE
|  |  |
.TS
box;
c c c
l l l.
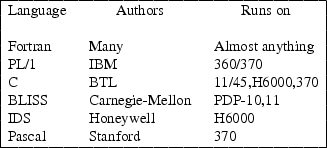
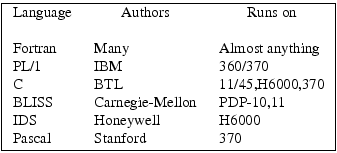
Language Authors Runs on
Fortran Many Almost anything
PL/1 IBM 360/370
C BTL 11/45,H6000,370
BLISS Carnegie-Mellon PDP-10,11
IDS Honeywell H6000
Pascal Stanford 370
.TE
|  |  |
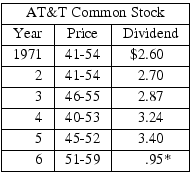
.TS
allbox;
c s s
c c c
n n n.
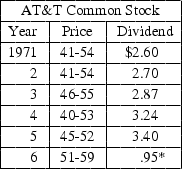
AT&T Common Stock
Year Price Dividend
1971 41-54 $2.60
2 41-54 2.70
3 46-55 2.87
4 40-53 3.24
5 45-52 3.40
6 51-59 .95*
.TE
|
 |  |
.TS
box;
c s s
c | c | c
l | l | n.
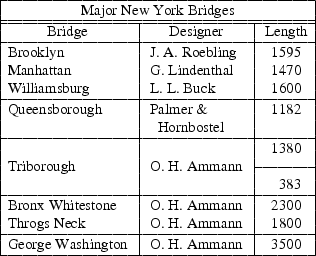
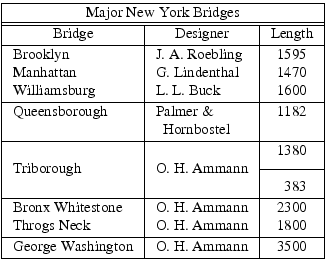
Major New York Bridges
=
Bridge Designer Length
_
Brooklyn J. A. Roebling 1595
Manhattan G. Lindenthal 1470
Williamsburg L. L. Buck 1600
_
Queensborough Palmer & 1182
Hornbostel
_
1380
Triborough O. H. Ammann _
383
_
Bronx Whitestone O. H. Ammann 2300
Throgs Neck O. H. Ammann 1800
_
George Washington O. H. Ammann 3500
.TE
|  |  |
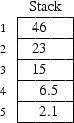
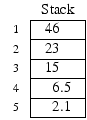
.TS
c c
np-2 | n |.
	Stack
	_
1	46
	_
2	23
	_
3	15
	_
4	6.5
	_
5	2.1
	_
.TE
|  |  |
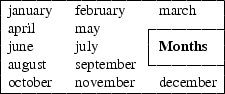
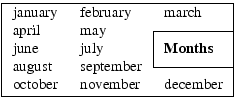
.TS
box;
L L L
L L _
L L | LB
L L _
L L L.
january	february	march
april	may
june	july	Months
august	september
october	november	december
.TE
|  |  |
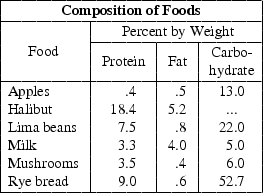
.TS
box;
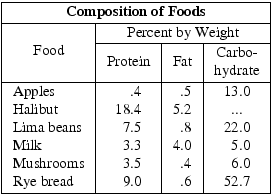
cfB s s s.
Composition of Foods
_
.T&
c |c s s
c |c s s
c |c |c |c.
Food Percent by Weight
\^ _
\^ Protein Fat Carbo-
\^ \^ \^ hydrate
_
.T&
l |n |n |n.
Apples .4 .5 13.0
Halibut 18.4 5.2 ...
Lima beans 7.5 .8 22.0
Milk 3.3 4.0 5.0
Mushrooms 3.5 .4 6.0
Rye bread 9.0 .6 52.7
.TE
|  |  |
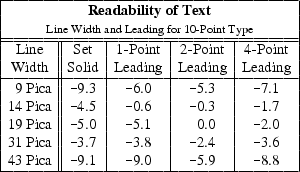
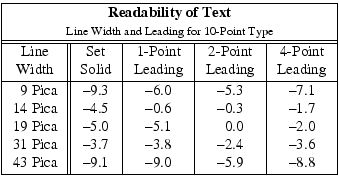
.TS
box, tab(:);
cb s s s s
cp-2 s s s s
c ||c |c |c |c
c ||c |c |c |c
r2 ||n2 |n2 |n2 |n.
Readability of Text
Line Width and Leading for 10-Point Type
=
Line:Set:1-Point:2-Point:4-Point
Width:Solid:Leading:Leading:Leading
_
9 Pica:\-9.3:\-6.0:\-5.3:\-7.1
14 Pica:\-4.5:\-0.6:\-0.3:\-1.7
19 Pica:\-5.0:\-5.1: 0.0:\-2.0
31 Pica:\-3.7:\-3.8:\-2.4:\-3.6
43 Pica:\-9.1:\-9.0:\-5.9:\-8.8
.TE
|  |  |
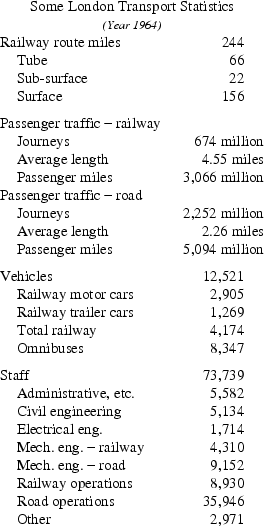
.TS
c s
cip-2 s
l n
a n.
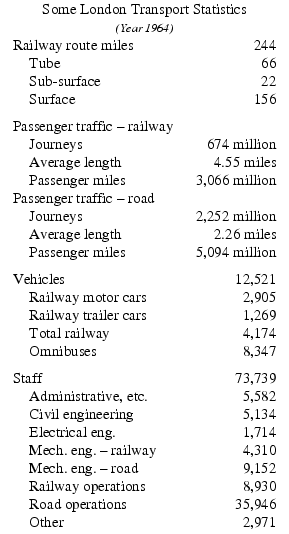
Some London Transport Statistics
(Year 1964)
Railway route miles 244
Tube 66
Sub-surface 22
Surface 156
.sp .5
.T&
l r
a r.
Passenger traffic \(mi railway
Journeys 674 million
Average length 4.55 miles
Passenger miles 3,066 million
.T&
l r
a r.
Passenger traffic \(mi road
Journeys 2,252 million
Average length 2.26 miles
Passenger miles 5,094 million
.T&
l n
a n.
.sp .5
Vehicles 12,521
Railway motor cars 2,905
Railway trailer cars 1,269
Total railway 4,174
Omnibuses 8,347
.T&
l n
a n.
.sp .5
Staff 73,739
Administrative, etc. 5,582
Civil engineering 5,134
Electrical eng. 1,714
Mech. eng. \(mi railway 4,310
Mech. eng. \(mi road 9,152
Railway operations 8,930
Road operations 35,946
Other 2,971
.TE
|  |  |